
Overview
|
|
|||||||
| Annualized | |||||||
| 1 Mo. | 3 Mos. | YTD | 1 Yr. | 3 Yrs. | 5 Yrs. | 10 Yrs. | |
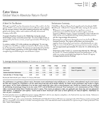
| Fund at NAV | 0.96 | 2.39 | 2.39 | 12.87 | 5.30 | 4.73 | 4.30 |
| Morningstar® LSTA® US Leveraged Loan Index2 | 0.85 | 2.46 | 2.46 | 12.47 | 5.99 | 5.47 | 4.54 |
| Past performance is no guarantee of future results. Investment return and principal value will fluctuate so that shares, when redeemed, may be worth more or less than their original cost. Performance is for the stated time period only; due to market volatility, the Fund’s current performance may be lower or higher than quoted. Returns are historical and are calculated by determining the percentage change in net asset value (NAV) with all distributions reinvested. Returns for other classes of shares offered by the Fund are different. Performance less than or equal to one year is cumulative. Total return prior to the commencement of the class reflects returns of Eaton Vance Prime Rate Reserves, the Fund's Predecessor. Prior returns are adjusted to reflect applicable sales charge (but were not adjusted for other expenses). If adjusted for other expenses, returns would be lower. The share class has no sales charge. | |||||||
| ADV Class Inception | 03/17/2008 |
| Performance Inception | 08/04/1989 |
| Investment Objective | High current income |
| Total Net Assets | $5.7B |
| Minimum Investment | $1000 |
| Expense Ratio3 | 2.82% |
| Adjusted Expense Ratio | 1.00% |
| CUSIP | 277923678 |
| Adjusted Expense Ratios excludes certain investment expenses such as interest expense from borrowings and repurchase agreements and dividend expense from short sales, incurred directly by the Fund or indirectly through the Fund’s investment in underlying Eaton Vance Funds, if applicable none of which are paid to Eaton Vance. |
| TransDigm Inc. | 1.10 |
| Epicor Software Corporation | 1.05 |
| Carnival Corporation | 1.01 |
| Applied Systems Inc. | 0.91 |
| Go Daddy Operating Company LLC | 0.86 |
| American Airlines Inc. | 0.81 |
| Ineos US Finance LLC | 0.80 |
| Uber Technologies Inc. | 0.74 |
| Stars Group Holdings B.V. (The) | 0.73 |
| Select Medical Corporation | 0.73 |
| Total | 8.74 |
| Time Period | Rating | Funds in Bank Loan Category |
| Overall | 214 | |
| 3 Years | 214 | |
| 5 Years | 206 | |
| 10 Years | 169 | |
| The Morningstar Rating™ for funds, or "star rating", is calculated for managed products (including mutual funds and exchange-traded funds) with at least a three-year history. Exchange-traded funds and open-ended mutual funds are considered a single population for comparative purposes. It is calculated based on a Morningstar Risk-Adjusted Return measure that accounts for variation in a managed product's monthly excess performance, placing more emphasis on downward variations and rewarding consistent performance. The top 10% of products in each product category receive 5 stars, the next 22.5% receive 4 stars, the next 35% receive 3 stars, the next 22.5% receive 2 stars, and the bottom 10% receive 1 star. The Overall Morningstar Rating for a managed product is derived from a weighted average of the performance figures associated with its three-, five-, and 10-year (if applicable) Morningstar Rating metrics. The weights are: 100% three-year rating for 36-59 months of total returns, 60% five-year rating/40% three-year rating for 60-119 months of total returns, and 50% 10-year rating/30% five-year rating/20% three-year rating for 120 or more months of total returns. While the 10-year overall star rating formula seems to give the most weight to the 10-year period, the most recent three-year period actually has the greatest impact because it is included in all three rating periods. Star ratings do not reflect the effect of any applicable sales load. Hollow stars denote Morningstar Extended Performance Ratings and are considered estimates based on the performance of the fund's oldest share class, adjusted for fees and expenses. ©2024 Morningstar. All Rights Reserved. The information contained herein: (1) is proprietary to Morningstar and/or its content providers; (2) may not be copied or distributed; and (3) is not warranted to be accurate, complete or timely. Neither Morningstar nor its content providers are responsible for any damages or losses arising from any use of this information. |
| Andrew N. Sveen, CFA | Managed Fund since 2019 | ||
| Ralph Hinckley, CFA | Managed Fund since 2021 | ||
| Jake Lemle, CFA | Managed Fund since 2021 |
Portfolio profile subject to change due to active management. Percentages may not total 100% due to rounding. Fund invests in an affiliated investment company (Portfolio) with the same objective(s) and policies as the Fund. References to investments are to the Portfolio's holdings.
RISK CONSIDERATIONS
The value of investments held by the Fund may increase or decrease in response to economic, and financial events (whether real, expected or perceived) in the U.S. and global markets. Loans are traded in a private, unregulated inter-dealer or inter-bank resale market and are generally subject to contractual restrictions that must be satisfied before a loan can be bought or sold. These restrictions may impede the Fund's ability to buy or sell loans (thus affecting their liquidity) and may negatively impact the transaction price. It may take longer than seven days for transactions in loans to settle. Due to the possibility of an extended loan settlement process, the Fund may hold cash, sell investments or temporarily borrow from banks or other lenders to meet short-term liquidity needs. Loans may be structured such that they are not securities under securities law, and in the event of fraud or misrepresentation by a borrower, lenders may not have the protection of the anti-fraud provisions of the federal securities laws. Loans are also subject to risks associated with other types of income investments. Investments in debt instruments may be affected by changes in the creditworthiness of the issuer and are subject to the risk of non-payment of principal and interest. The value of income securities also may decline because of real or perceived concerns about the issuer's ability to make principal and interest payments. Borrowing to increase investments ("leverage") may exaggerate the effect of any increase or decrease in the value of Fund investments. Investments rated below investment grade (sometimes referred to as "junk") are typically subject to greater price volatility and illiquidity than higher rated investments. As interest rates rise, the value of certain income investments is likely to decline. The London Interbank Offered Rate or LIBOR, is used throughout global banking and financial industries to determine interest rates for a variety of financial instruments (such as debt instruments and derivatives) and borrowing arrangements. The ICE Benchmark Administration Limited, the administrator of LIBOR, ceased publishing certain LIBOR settings on December 31, 2021, and is expected to cease publishing the remaining LIBOR settings on June 30, 2023. The transition process may involve, among other things, increased volatility or illiquidity in markets for instruments that currently rely on LIBOR, such as floating-rate debt obligations. Investments in foreign instruments or currencies can involve greater risk and volatility than U.S. investments because of adverse market, economic, political, regulatory, geopolitical, currency exchange rates or other conditions. Changes in the value of investments entered for hedging purposes may not match those of the position being hedged. The Fund is exposed to liquidity risk when trading volume, lack of a market maker or trading partner, large position size, market conditions, or legal restrictions impair its ability to sell particular investments or to sell them at advantageous market prices. The impact of the coronavirus on global markets could last for an extended period and could adversely affect the Fund’s performance. No fund is a complete investment program and you may lose money investing in a fund. The Fund may engage in other investment practices that may involve additional risks and you should review the Fund prospectus for a complete description.
Performance
|
|
|||||||
| Annualized | |||||||
| 1 Mo. | 3 Mos. | YTD | 1 Yr. | 3 Yrs. | 5 Yrs. | 10 Yrs. | |
| Fund at NAV | 0.96 | 2.39 | 2.39 | 12.87 | 5.30 | 4.73 | 4.30 |
| Morningstar® LSTA® US Leveraged Loan Index2 | 0.85 | 2.46 | 2.46 | 12.47 | 5.99 | 5.47 | 4.54 |
| Morningstar Bank Loan Category5 | 0.86 | 2.33 | 2.33 | 11.57 | 4.77 | 4.14 | 3.49 |
| Past performance is no guarantee of future results. Investment return and principal value will fluctuate so that shares, when redeemed, may be worth more or less than their original cost. Performance is for the stated time period only; due to market volatility, the Fund’s current performance may be lower or higher than quoted. Returns are historical and are calculated by determining the percentage change in net asset value (NAV) with all distributions reinvested. Returns for other classes of shares offered by the Fund are different. Performance less than or equal to one year is cumulative. Total return prior to the commencement of the class reflects returns of Eaton Vance Prime Rate Reserves, the Fund's Predecessor. Prior returns are adjusted to reflect applicable sales charge (but were not adjusted for other expenses). If adjusted for other expenses, returns would be lower. The share class has no sales charge. | |||||||
| 2014 | 2015 | 2016 | 2017 | 2018 | 2019 | 2020 | 2021 | 2022 | 2023 | |
| Fund at NAV | 0.69 | -1.84 | 12.67 | 4.78 | 0.12 | 8.63 | 1.72 | 5.14 | -3.25 | 14.16 |
| Morningstar® LSTA® US Leveraged Loan Index2 | 1.60 | -0.69 | 10.16 | 4.12 | 0.44 | 8.64 | 3.12 | 5.20 | -0.77 | 13.32 |
| ADV Class Inception | 03/17/2008 |
| Performance Inception | 08/04/1989 |
| Expense Ratio3 | 2.82% |
| Adjusted Expense Ratio | 1.00% |
| Distribution Frequency | Monthly |
| Adjusted Expense Ratios excludes certain investment expenses such as interest expense from borrowings and repurchase agreements and dividend expense from short sales, incurred directly by the Fund or indirectly through the Fund’s investment in underlying Eaton Vance Funds, if applicable none of which are paid to Eaton Vance. |
| Distribution Rate at NAV | 8.96% |
| SEC 30-day Yield6 | 9.13% |
| Time Period | Rating | Funds in Bank Loan Category |
| Overall | 214 | |
| 3 Years | 214 | |
| 5 Years | 206 | |
| 10 Years | 169 | |
| The Morningstar Rating™ for funds, or "star rating", is calculated for managed products (including mutual funds and exchange-traded funds) with at least a three-year history. Exchange-traded funds and open-ended mutual funds are considered a single population for comparative purposes. It is calculated based on a Morningstar Risk-Adjusted Return measure that accounts for variation in a managed product's monthly excess performance, placing more emphasis on downward variations and rewarding consistent performance. The top 10% of products in each product category receive 5 stars, the next 22.5% receive 4 stars, the next 35% receive 3 stars, the next 22.5% receive 2 stars, and the bottom 10% receive 1 star. The Overall Morningstar Rating for a managed product is derived from a weighted average of the performance figures associated with its three-, five-, and 10-year (if applicable) Morningstar Rating metrics. The weights are: 100% three-year rating for 36-59 months of total returns, 60% five-year rating/40% three-year rating for 60-119 months of total returns, and 50% 10-year rating/30% five-year rating/20% three-year rating for 120 or more months of total returns. While the 10-year overall star rating formula seems to give the most weight to the 10-year period, the most recent three-year period actually has the greatest impact because it is included in all three rating periods. Star ratings do not reflect the effect of any applicable sales load. Hollow stars denote Morningstar Extended Performance Ratings and are considered estimates based on the performance of the fund's oldest share class, adjusted for fees and expenses. ©2024 Morningstar. All Rights Reserved. The information contained herein: (1) is proprietary to Morningstar and/or its content providers; (2) may not be copied or distributed; and (3) is not warranted to be accurate, complete or timely. Neither Morningstar nor its content providers are responsible for any damages or losses arising from any use of this information. |
| Date | NAV | NAV Change |
| Apr 17, 2024 | $10.03 | $0.00 |
| Apr 16, 2024 | $10.03 | -$0.01 |
| Apr 15, 2024 | $10.04 | $0.00 |
| Apr 12, 2024 | $10.04 | $0.00 |
| Apr 11, 2024 | $10.04 | -$0.01 |
| Apr 10, 2024 | $10.05 | -$0.01 |
| Apr 09, 2024 | $10.06 | $0.00 |
| Apr 08, 2024 | $10.06 | $0.00 |
| Apr 05, 2024 | $10.06 | $0.00 |
| Apr 04, 2024 | $10.06 | -$0.01 |
| Ex-Date | Distribution | Reinvest NAV |
| Mar 28, 2024 | $0.07644 | $10.07 |
| Feb 29, 2024 | $0.07306 | $10.05 |
| Jan 31, 2024 | $0.07913 | $10.04 |
| Dec 29, 2023 | $0.11026 | $10.06 |
| Nov 30, 2023 | $0.07909 | $9.97 |
| Oct 31, 2023 | $0.07387 | $9.87 |
| Sep 29, 2023 | $0.07149 | $9.99 |
| Aug 31, 2023 | $0.08170 | $10.00 |
| Jul 31, 2023 | $0.07751 | $9.95 |
| Jun 30, 2023 | $0.07317 | $9.87 |
| View All | ||
| No records in this table indicates that there has not been a distribution greater than .0001 within the past 3 years. Fund prospectus |

| Ex-Date | Short-Term | Long-Term | Reinvest NAV |
| No records in this table indicates that there has not been a capital gain greater than .0001 within the past 3 years. Fund prospectus |
Portfolio profile subject to change due to active management. Percentages may not total 100% due to rounding. Fund invests in an affiliated investment company (Portfolio) with the same objective(s) and policies as the Fund. References to investments are to the Portfolio's holdings.
RISK CONSIDERATIONS
The value of investments held by the Fund may increase or decrease in response to economic, and financial events (whether real, expected or perceived) in the U.S. and global markets. Loans are traded in a private, unregulated inter-dealer or inter-bank resale market and are generally subject to contractual restrictions that must be satisfied before a loan can be bought or sold. These restrictions may impede the Fund's ability to buy or sell loans (thus affecting their liquidity) and may negatively impact the transaction price. It may take longer than seven days for transactions in loans to settle. Due to the possibility of an extended loan settlement process, the Fund may hold cash, sell investments or temporarily borrow from banks or other lenders to meet short-term liquidity needs. Loans may be structured such that they are not securities under securities law, and in the event of fraud or misrepresentation by a borrower, lenders may not have the protection of the anti-fraud provisions of the federal securities laws. Loans are also subject to risks associated with other types of income investments. Investments in debt instruments may be affected by changes in the creditworthiness of the issuer and are subject to the risk of non-payment of principal and interest. The value of income securities also may decline because of real or perceived concerns about the issuer's ability to make principal and interest payments. Borrowing to increase investments ("leverage") may exaggerate the effect of any increase or decrease in the value of Fund investments. Investments rated below investment grade (sometimes referred to as "junk") are typically subject to greater price volatility and illiquidity than higher rated investments. As interest rates rise, the value of certain income investments is likely to decline. The London Interbank Offered Rate or LIBOR, is used throughout global banking and financial industries to determine interest rates for a variety of financial instruments (such as debt instruments and derivatives) and borrowing arrangements. The ICE Benchmark Administration Limited, the administrator of LIBOR, ceased publishing certain LIBOR settings on December 31, 2021, and is expected to cease publishing the remaining LIBOR settings on June 30, 2023. The transition process may involve, among other things, increased volatility or illiquidity in markets for instruments that currently rely on LIBOR, such as floating-rate debt obligations. Investments in foreign instruments or currencies can involve greater risk and volatility than U.S. investments because of adverse market, economic, political, regulatory, geopolitical, currency exchange rates or other conditions. Changes in the value of investments entered for hedging purposes may not match those of the position being hedged. The Fund is exposed to liquidity risk when trading volume, lack of a market maker or trading partner, large position size, market conditions, or legal restrictions impair its ability to sell particular investments or to sell them at advantageous market prices. The impact of the coronavirus on global markets could last for an extended period and could adversely affect the Fund’s performance. No fund is a complete investment program and you may lose money investing in a fund. The Fund may engage in other investment practices that may involve additional risks and you should review the Fund prospectus for a complete description.
Portfolio
|
|
|
| Floating-Rate Loans | 85.59 |
| Corporate Bonds | 9.36 |
| Other Net Assets | 4.78 |
| Cash & Equivalents | 0.27 |
| Total | 100.00 |
| Number of Loan Issuers | 399 |
| Number of Industries | 54 |
| Average Coupon | 8.62% |
| Average Maturity | 4.61 yrs. |
| Average Loan Size (% of TA) | 0.22 |
| Average Loan Size | $16.0M |
| Average Duration | 0.42 yrs. |
| Average Price | $96.61 |
| Software | 13.08 |
| Hotels Restaurants & Leisure | 5.79 |
| Machinery | 5.23 |
| Health Care Providers & Services | 4.97 |
| Chemicals | 4.79 |
| Capital Markets | 4.71 |
| IT Services | 3.58 |
| Professional Services | 3.25 |
| Trading Companies & Distributors | 2.99 |
| Insurance | 2.70 |
| View All |
|
|
|
| BBB | 6.96 |
| BB | 23.97 |
| B | 57.85 |
| CCC or Lower | 5.80 |
| Not Rated | 5.41 |
| Total | 100.00 |
| Credit ratings are categorized using S&P. Ratings, which are subject to change, apply to the creditworthiness of the issuers of the underlying securities and not to the Fund or its shares. Credit ratings measure the quality of a bond based on the issuer's creditworthiness, with ratings ranging from AAA, being the highest, to D, being the lowest based on S&P's measures. Ratings of BBB or higher by S&P are considered to be investment-grade quality. Credit ratings are based largely on the ratings agency's analysis at the time of rating. The rating assigned to any particular security is not necessarily a reflection of the issuer's current financial condition and does not necessarily reflect its assessment of the volatility of a security's market value or of the liquidity of an investment in the security. Holdings designated as "Not Rated" are not rated by S&P. |
|
|
|
| Less Than 1 Year | 1.18 |
| 1 To 3 Years | 14.79 |
| 3 To 5 Years | 50.64 |
| 5 To 10 Years | 32.40 |
| 10 To 20 Years | 0.98 |
| 20 To 30 Years | 0.00 |
| More Than 30 Years | 0.00 |
| Total | 100.00 |
| United States | 80.44 |
| Luxembourg | 4.71 |
| Canada | 3.44 |
| Netherlands | 3.02 |
| United Kingdom | 2.37 |
| Germany | 2.11 |
| France | 1.89 |
| Other | 2.01 |
| First Lien | 98.81 |
| Second Lien | 1.19 |
| Holding | Coupon Rate | Maturity Date | % of Net Assets |
| Epicor | 8.69% | 07/30/2027 | 1.08% |
| Applied Systems Inc | 8.82% | 02/07/2031 | 1.05% |
| MSILF GOVERNMENT PORTFOLIO | 5.21% | 12/31/2030 | 0.95% |
| Go Daddy | 7.33% | 11/09/2029 | 0.85% |
| Uber Technologies Inc | 8.08% | 03/04/2030 | 0.84% |
| Select Medical Corporation | 8.33% | 03/06/2027 | 0.84% |
| Coinmach | 9.62% | 03/04/2028 | 0.72% |
| Restaurant Brands International | 7.58% | 09/20/2030 | 0.70% |
| ICON Luxembourg S.A.R.L. | 7.86% | 07/03/2028 | 0.70% |
| EURO | 0.70% | ||
| View All |
Portfolio profile subject to change due to active management. Percentages may not total 100% due to rounding. Fund invests in an affiliated investment company (Portfolio) with the same objective(s) and policies as the Fund. References to investments are to the Portfolio's holdings.
RISK CONSIDERATIONS
The value of investments held by the Fund may increase or decrease in response to economic, and financial events (whether real, expected or perceived) in the U.S. and global markets. Loans are traded in a private, unregulated inter-dealer or inter-bank resale market and are generally subject to contractual restrictions that must be satisfied before a loan can be bought or sold. These restrictions may impede the Fund's ability to buy or sell loans (thus affecting their liquidity) and may negatively impact the transaction price. It may take longer than seven days for transactions in loans to settle. Due to the possibility of an extended loan settlement process, the Fund may hold cash, sell investments or temporarily borrow from banks or other lenders to meet short-term liquidity needs. Loans may be structured such that they are not securities under securities law, and in the event of fraud or misrepresentation by a borrower, lenders may not have the protection of the anti-fraud provisions of the federal securities laws. Loans are also subject to risks associated with other types of income investments. Investments in debt instruments may be affected by changes in the creditworthiness of the issuer and are subject to the risk of non-payment of principal and interest. The value of income securities also may decline because of real or perceived concerns about the issuer's ability to make principal and interest payments. Borrowing to increase investments ("leverage") may exaggerate the effect of any increase or decrease in the value of Fund investments. Investments rated below investment grade (sometimes referred to as "junk") are typically subject to greater price volatility and illiquidity than higher rated investments. As interest rates rise, the value of certain income investments is likely to decline. The London Interbank Offered Rate or LIBOR, is used throughout global banking and financial industries to determine interest rates for a variety of financial instruments (such as debt instruments and derivatives) and borrowing arrangements. The ICE Benchmark Administration Limited, the administrator of LIBOR, ceased publishing certain LIBOR settings on December 31, 2021, and is expected to cease publishing the remaining LIBOR settings on June 30, 2023. The transition process may involve, among other things, increased volatility or illiquidity in markets for instruments that currently rely on LIBOR, such as floating-rate debt obligations. Investments in foreign instruments or currencies can involve greater risk and volatility than U.S. investments because of adverse market, economic, political, regulatory, geopolitical, currency exchange rates or other conditions. Changes in the value of investments entered for hedging purposes may not match those of the position being hedged. The Fund is exposed to liquidity risk when trading volume, lack of a market maker or trading partner, large position size, market conditions, or legal restrictions impair its ability to sell particular investments or to sell them at advantageous market prices. The impact of the coronavirus on global markets could last for an extended period and could adversely affect the Fund’s performance. No fund is a complete investment program and you may lose money investing in a fund. The Fund may engage in other investment practices that may involve additional risks and you should review the Fund prospectus for a complete description.
Management

Andrew N. Sveen, CFA
Managing Director, Chairman of MSIM Fixed Income and Head of Floating-Rate Loans
Joined Eaton Vance 1999
Biography
Andrew Sveen is the Chairman of MSIM Fixed Income. In addition, he is the Head of Floating-Rate Loans and a portfolio manager on the Floating-Rate Loans team. He is responsible for buy and sell decisions, portfolio construction, and risk management for the firm's floating-rate loan strategies. He joined Eaton Vance in 1999. Morgan Stanley acquired Eaton Vance in March 2021.
Andrew began his career in the investment industry in 1995. Previously at Eaton Vance, he was a Director within Loan Trading and Capital Markets. Before joining Eaton Vance, he worked as a corporate lending officer at State Street Bank.
Andrew earned a B.A. from Dartmouth College and an M.B.A. from the William E. Simon School at the University of Rochester. He also holds the Chartered Financial Analyst designation. Andrew serves as a member of the Board of Directors of the Loan Syndications and Trading Association (LSTA).
Education
- B.A. Dartmouth College
- M.B.A. University of Rochester
Experience
- Managed Fund since 2019
Other funds managed

Ralph Hinckley, CFA
Managing Director, Portfolio Manager
Joined Eaton Vance 2003
Biography
Ralph Hinckley is a portfolio manager on the Floating-Rate Loans team. He is responsible for buy and sell decisions, portfolio construction and risk management for the firm's floating-rate loan strategies. He joined Eaton Vance in 2003. Morgan Stanley acquired Eaton Vance in March 2021.
Ralph began his career in the investment management industry in 1997. Before joining Eaton Vance, he was a vice president in the communications lending division of Citizens Bank and its credit training program and a lending officer at State Street Bank.
Ralph earned a B.A. from Bates College and an MBA, with honors, from Boston University Graduate School of Management. He is a member of the CFA Society Boston and is a CFA charterholder.
Education
- B.A. Bates College
- M.B.A. Boston University
Experience
- Managed Fund since 2021
Other funds managed

Jake Lemle, CFA
Managing Director, Portfolio Manager
Joined Eaton Vance 2007
Biography
Jake Lemle is the director of loan trading and a portfolio manager on the Floating-Rate Loans team. He is responsible for trading high-yield loans and bonds for the senior debt group as well as public funds, separate accounts, commingled institutional accounts and structured products. He also has responsibilities for buy and sell decisions, portfolio construction and risk management. He began his career in the investment management industry with Eaton Vance in 2007. Morgan Stanley acquired Eaton Vance in March 2021.
Jake earned a B.S. from Georgetown University. He is on the board of advisors of Artists for Humanity in South Boston and a member of the Acquisitions Circle of the Institute of Contemporary Art, Boston. He is a CFA charterholder.
Education
- B.S. Georgetown University
Experience
- Managed Fund since 2021
Other funds managed
Literature
Literature

Fact Sheet
Download Fact Sheet - Last updated: Mar 31, 2024
Floating-Rate Loan Funds Quarterly Investment Review
Download Floating-Rate Loan Funds Quarterly Investment Review - Last updated: Mar 31, 2024

Monthly Review
Download Monthly Review - Last updated: Mar 31, 2024
Floating-Rate Loan Market Monitor
Download Floating-Rate Loan Market Monitor - Last updated: Mar 31, 2024

Annual Report
Download Annual Report - Last updated: Oct 31, 2023

Full Prospectus
Download Full Prospectus - Last updated: Mar 1, 2024
Q1 Holdings
Download Q1 Holdings - Last updated: Jan 31, 2024
Q3 Holdings
Download Q3 Holdings - Last updated: Jul 31, 2023
Holdings - Form N-PORT

SAI
Download SAI - Last updated: Mar 1, 2024

Semi-Annual Report
Download Semi-Annual Report - Last updated: Apr 30, 2023

Summary Prospectus
Download Summary Prospectus - Last updated: Mar 1, 2024
