
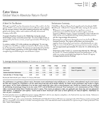
Overview
|
|
|||||||
| Annualized | |||||||
| 1 Mo. | 3 Mos. | YTD | 1 Yr. | 3 Yrs. | 5 Yrs. | 10 Yrs. | |
| Fund at NAV | 2.05 | -0.41 | -0.41 | 7.29 | -2.49 | 4.18 | 4.42 |
| MSCI EAFE Small/Mid Cap Index1 | 3.49 | 3.08 | 3.08 | 11.48 | -0.46 | 5.06 | 4.55 |
| Past performance is no guarantee of future results. Investment return and principal value will fluctuate so that shares, when redeemed, may be worth more or less than their original cost. Performance is for the stated time period only; due to market volatility, the Fund’s current performance may be lower or higher than quoted. Returns are historical and are calculated by determining the percentage change in net asset value (NAV) with all distributions reinvested. Returns for other classes of shares offered by the Fund are different. Performance less than or equal to one year is cumulative. Performance prior to December 31, 2016 reflects the performance of the Fund’s former adviser, Calvert Investment Management, Inc. | |||||||
| Class R6 Inception | 02/01/2019 |
| Performance Inception | 05/31/2007 |
| Investment Objective | Long-term capital appreciation |
| Total Net Assets | $368.8M |
| Minimum Investment | $5000000 |
| Expense Ratio2 | 1.01% |
| CUSIP | 131649758 |
| CAR Group Ltd | 1.85 |
| BFF Bank SpA | 1.78 |
| Diploma PLC | 1.75 |
| IPSOS SA | 1.73 |
| IMCD NV | 1.71 |
| DiscoverIE Group PLC | 1.61 |
| JTC PLC | 1.61 |
| iShares MSCI Hong Kong ETF | 1.56 |
| Cranswick PLC | 1.56 |
| Chiba Bank Ltd | 1.55 |
| Total | 16.71 |
| Aidan M. Farrell | Managed Fund since 2016 | ||
| Allen Mayer, ACA, CFA | Managed Fund since 2024 |
Portfolio profile subject to change due to active management. Percentages may not total 100% due to rounding.
RISK CONSIDERATIONS
The value of investments held by the Fund may increase or decrease in response to economic, and financial events (whether real, expected or perceived) in the U.S. and global markets. The value of equity securities is sensitive to stock market volatility. Smaller companies are generally subject to greater price fluctuations, limited liquidity, higher transaction costs and higher investment risk than larger, more established companies. Investments in foreign instruments or currencies can involve greater risk and volatility than U.S. investments because of adverse market, economic, political, regulatory, geopolitical, currency exchange rates or other conditions. Investing primarily in responsible investments carries the risk that, under certain market conditions, the Fund may underperform funds that do not utilize a responsible investment strategy. The Fund is exposed to liquidity risk when trading volume, lack of a market maker or trading partner, large position size, market conditions, or legal restrictions impair its ability to sell particular investments or to sell them at advantageous market prices. The impact of the coronavirus on global markets could last for an extended period and could adversely affect the Fund’s performance. No fund is a complete investment program and you may lose money investing in a fund. The Fund may engage in other investment practices that may involve additional risks and you should review the Fund prospectus for a complete description.
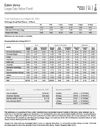
Performance
|
|
|||||||
| Annualized | |||||||
| 1 Mo. | 3 Mos. | YTD | 1 Yr. | 3 Yrs. | 5 Yrs. | 10 Yrs. | |
| Fund at NAV | 2.05 | -0.41 | -0.41 | 7.29 | -2.49 | 4.18 | 4.42 |
| MSCI EAFE Small/Mid Cap Index1 | 3.49 | 3.08 | 3.08 | 11.48 | -0.46 | 5.06 | 4.55 |
| Morningstar Foreign Small/Mid Growth Category5 | 2.10 | 2.45 | 2.45 | 9.14 | -4.14 | 5.12 | 4.56 |
| Past performance is no guarantee of future results. Investment return and principal value will fluctuate so that shares, when redeemed, may be worth more or less than their original cost. Performance is for the stated time period only; due to market volatility, the Fund’s current performance may be lower or higher than quoted. Returns are historical and are calculated by determining the percentage change in net asset value (NAV) with all distributions reinvested. Returns for other classes of shares offered by the Fund are different. Performance less than or equal to one year is cumulative. Performance prior to December 31, 2016 reflects the performance of the Fund’s former adviser, Calvert Investment Management, Inc. | |||||||
| 2014 | 2015 | 2016 | 2017 | 2018 | 2019 | 2020 | 2021 | 2022 | 2023 | |
| Fund at NAV | — | — | — | — | — | 26.14 | 14.08 | 13.96 | -26.63 | 13.08 |
| MSCI EAFE Small/Mid Cap Index1 | -3.31 | 6.61 | 1.32 | 30.78 | -16.95 | 24.37 | 11.34 | 8.76 | -20.82 | 15.05 |
| Class R6 Inception | 02/01/2019 |
| Performance Inception | 05/31/2007 |
| Expense Ratio2 | 1.01% |
| Distribution Frequency | Annually |
| Alpha (%) | -1.63 |
| Beta | 1.12 |
| Information Ratio | -0.33 |
| R-Squared (%) | 92.62 |
| Standard Deviation (%) | 21.10 |
| Sharpe Ratio | -0.24 |
| Date | NAV | NAV Change |
| Apr 26, 2024 | $16.40 | $0.09 |
| Apr 25, 2024 | $16.31 | -$0.08 |
| Apr 24, 2024 | $16.39 | -$0.06 |
| Apr 23, 2024 | $16.45 | $0.18 |
| Apr 22, 2024 | $16.27 | $0.25 |
| Apr 19, 2024 | $16.02 | -$0.13 |
| Apr 18, 2024 | $16.15 | -$0.02 |
| Apr 17, 2024 | $16.17 | $0.02 |
| Apr 16, 2024 | $16.15 | -$0.16 |
| Apr 15, 2024 | $16.31 | -$0.08 |
| Ex-Date | Distribution | Reinvest NAV |
| Dec 21, 2023 | $0.31100 | $16.82 |
| Dec 22, 2022 | $0.11970 | $15.19 |
| Dec 21, 2021 | $0.33500 | $20.35 |
| No records in this table indicates that there has not been a distribution greater than .0001 within the past 3 years. Fund prospectus |
| Ex-Date | Short-Term | Long-Term | Reinvest NAV |
| Dec 21, 2021 | $1.29490 | $20.35 | |
| No records in this table indicates that there has not been a capital gain greater than .0001 within the past 3 years. Fund prospectus |
Portfolio profile subject to change due to active management. Percentages may not total 100% due to rounding.
RISK CONSIDERATIONS
The value of investments held by the Fund may increase or decrease in response to economic, and financial events (whether real, expected or perceived) in the U.S. and global markets. The value of equity securities is sensitive to stock market volatility. Smaller companies are generally subject to greater price fluctuations, limited liquidity, higher transaction costs and higher investment risk than larger, more established companies. Investments in foreign instruments or currencies can involve greater risk and volatility than U.S. investments because of adverse market, economic, political, regulatory, geopolitical, currency exchange rates or other conditions. Investing primarily in responsible investments carries the risk that, under certain market conditions, the Fund may underperform funds that do not utilize a responsible investment strategy. The Fund is exposed to liquidity risk when trading volume, lack of a market maker or trading partner, large position size, market conditions, or legal restrictions impair its ability to sell particular investments or to sell them at advantageous market prices. The impact of the coronavirus on global markets could last for an extended period and could adversely affect the Fund’s performance. No fund is a complete investment program and you may lose money investing in a fund. The Fund may engage in other investment practices that may involve additional risks and you should review the Fund prospectus for a complete description.
Portfolio
|
|
|
| Foreign Common Stocks | 97.22 |
| Other | 2.74 |
| Cash | 0.05 |
| Total | 100.00 |
| Number of Holdings | 98 |
|
|
||
| Sector | Fund | MSCI EAFE Small/Mid Cap Index1 |
| Comm. Services | 5.89 | 4.86 |
| Consumer Discretionary | 10.90 | 11.36 |
| Consumer Staples | 6.13 | 5.78 |
| Energy | — | 2.78 |
| Financials | 16.52 | 14.54 |
| Health Care | 8.49 | 6.21 |
| Industrials | 22.24 | 22.76 |
| Information Technology | 12.67 | 9.37 |
| Materials | 3.50 | 10.28 |
| Real Estate | 9.89 | 8.44 |
| Utilities | 0.99 | 3.63 |
| Other | 2.74 | — |
| Cash | 0.05 | — |
| Japan | 24.33 |
| United Kingdom | 21.38 |
| Italy | 9.30 |
| Sweden | 8.86 |
| Australia | 7.77 |
| Netherlands | 4.91 |
| Belgium | 3.13 |
| Canada | 3.06 |
| Germany | 2.92 |
| United States | 2.74 |
| Total | 100.00 |
| View All |

|
|
|
| Europe | 60.42 |
| Asia/Pacific | 33.74 |
| North America | 5.79 |
| Cash & Other Assets | 0.05 |
| Total | 100.00 |
| Holding | % of Net Assets |
| MSILF GOVERNMENT PORTFOLIO | 2.34% |
| CAR Group Ltd | 1.83% |
| IPSOS SA | 1.71% |
| iShares MSCI Hong Kong ETF | 1.64% |
| Sanwa Holdings Corp | 1.63% |
| Diploma PLC | 1.63% |
| Judges Scientific PLC | 1.59% |
| BFF Bank SpA | 1.55% |
| JTC PLC | 1.53% |
| Chiba Bank Ltd | 1.51% |
| View All |
Portfolio profile subject to change due to active management. Percentages may not total 100% due to rounding.
RISK CONSIDERATIONS
The value of investments held by the Fund may increase or decrease in response to economic, and financial events (whether real, expected or perceived) in the U.S. and global markets. The value of equity securities is sensitive to stock market volatility. Smaller companies are generally subject to greater price fluctuations, limited liquidity, higher transaction costs and higher investment risk than larger, more established companies. Investments in foreign instruments or currencies can involve greater risk and volatility than U.S. investments because of adverse market, economic, political, regulatory, geopolitical, currency exchange rates or other conditions. Investing primarily in responsible investments carries the risk that, under certain market conditions, the Fund may underperform funds that do not utilize a responsible investment strategy. The Fund is exposed to liquidity risk when trading volume, lack of a market maker or trading partner, large position size, market conditions, or legal restrictions impair its ability to sell particular investments or to sell them at advantageous market prices. The impact of the coronavirus on global markets could last for an extended period and could adversely affect the Fund’s performance. No fund is a complete investment program and you may lose money investing in a fund. The Fund may engage in other investment practices that may involve additional risks and you should review the Fund prospectus for a complete description.
Management

Aidan M. Farrell
Managing Director, Co-Head of Non-US Small/Mid Cap
Joined Eaton Vance 2015
Biography
Aidan is a managing director of Morgan Stanley. He is Co-Head of the Eaton Vance Non-U.S. Small/Mid Cap team. He is responsible for managing global and international small-cap equity portfolios, leading a team of analysts. He joined Eaton Vance in 2015. Morgan Stanley acquired Eaton Vance in March 2021.
Aidan began his career in the investment management industry in 1996. Before joining Eaton Vance, he was managing director and a lead portfolio manager for Goldman Sachs Asset Management (GSAM). Prior to June 2008, he served as a director of European equities for Investment Insight (formerly the asset management arm of Halifax Bank of Scotland).
Aidan earned a B.A. in economics from the University College Dublin and a postgraduate diploma in business studies from the University College Dublin Michael Smurfit Graduate Business School. Aidan is an associate of the CFA Society of the UK.
Education
- B.A. University College Dublin
- Pg.Dip. University College Dublin
Experience
- Managed Fund since 2016
Other funds managed
Allen Mayer, ACA, CFA
Executive Director, Analyst
Biography
Allen is an executive director of Morgan Stanley and an analyst on the Eaton Vance Non-U.S. Small/Mid Cap team. He is responsible for providing multisector coverage across European and selected international markets for global small-cap portfolios.
He joined Eaton Vance in 2015. Morgan Stanley acquired Eaton Vance in March 2021. Allen began his career in the investment management industry in 2012. Before joining Eaton Vance, he was an executive director and equity analyst at Goldman Sachs Asset Management. He was previously affiliated with PricewaterhouseCoopers.
Allen earned a B.Sc. in business administration from the University of Bath and an MBA from the London Business School. He holds the Associate Chartered Accountant (ACA) designation and is a CFA charterholder.
Education
- B.Sc. University of Bath
- M.B.A. London Business School
Experience
- Managed Fund since 2024
Other funds managed
Literature
Literature

Fact Sheet
Download Fact Sheet - Last updated: Mar 31, 2024
Commentary
Download Commentary - Last updated: Dec 31, 2023
Attribution
Download Attribution - Last updated: Mar 31, 2024

Annual Report
Download Annual Report - Last updated: Sep 30, 2023

Full Prospectus
Download Full Prospectus - Last updated: Feb 1, 2024

Q1 Holdings
Download Q1 Holdings - Last updated: Dec 31, 2023
Q3 Holdings
Download Q3 Holdings - Last updated: Jun 30, 2023

SAI
Download SAI - Last updated: Feb 1, 2024

Semi-Annual Report
Download Semi-Annual Report - Last updated: Mar 31, 2023

Summary Prospectus
Download Summary Prospectus - Last updated: Feb 1, 2024
