
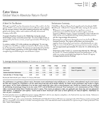
Overview
|
|
|||||||
| Annualized | |||||||
| 1 Mo. | 3 Mos. | YTD | 1 Yr. | 3 Yrs. | 5 Yrs. | 10 Yrs. | |
| Fund at NAV | 2.00 | 1.82 | 1.82 | 9.12 | 0.51 | 2.56 | 1.88 |
| Return After Taxes on Dist | — | — | — | 7.60 | -1.02 | 1.54 | 1.26 |
| Return After Taxes on Dist & Sales of Fund Shares | — | — | — | 6.31 | 0.69 | 2.27 | 1.69 |
| MSCI Emerging Markets Index1 | 2.48 | 2.37 | 2.37 | 8.15 | -5.05 | 2.22 | 2.94 |
| Past performance is no guarantee of future results. Investment return and principal value will fluctuate so that shares, when redeemed, may be worth more or less than their original cost. Performance is for the stated time period only; due to market volatility, the Fund’s current performance may be lower or higher than quoted. Returns are historical and are calculated by determining the percentage change in net asset value (NAV) with all distributions reinvested. Performance less than or equal to one year is cumulative. After-tax returns are calculated using certain assumptions, including using the highest individual federal income tax rates in effect at the time of the distributions and do not reflect the impact of state/local taxes. Actual after-tax returns depend on a shareholder's tax situation and the actual characterization of distributions and may differ from those shown. After-tax returns are not relevant to shareholders who hold shares in tax-deferred accounts or shares held by nontaxable entities. Return After Taxes on Distributions may be the same as Return Before Taxes for the same period because no taxable distributions were made during that period. Return After Taxes on Distributions and Sale of Fund Shares may be greater than or equal to Return After Taxes on Distributions for the same period because of losses realized on the sale of Fund shares. Before-tax and after-tax returns for other classes of shares offered by the Fund are different. The share class has no sales charge. |
|||||||
| Class I Inception | 06/30/1998 |
| Investment Objective | Long-term, after-tax return |
| Total Net Assets | $490.7M |
| Minimum Investment | $1000000 |
| Expense Ratio2 | 0.96% |
| Adjusted Expense Ratio | 0.95% |
| CUSIP | 277907606 |
| Adjusted Expense Ratios excludes certain investment expenses such as interest expense from borrowings and repurchase agreements and dividend expense from short sales, incurred directly by the Fund or indirectly through the Fund’s investment in underlying Parametric Funds, if applicable none of which are paid to Parametric. |
| Taiwan Semiconductor Manufac | 1.29 |
| Tencent Holdings Ltd | 1.14 |
| Samsung Electronics Co Ltd | 0.89 |
| Delta Electronics Thai-Forgn | 0.82 |
| Southern Copper Corp | 0.70 |
| America Movil Sab De C-Ser B | 0.68 |
| Tupras-Turkiye Petrol Rafine | 0.65 |
| Reliance Industries Ltd | 0.63 |
| Al Salam Bank Bsc | 0.62 |
| Mercadolibre Inc | 0.60 |
| Total | 8.03 |
| Thomas C. Seto | Managed Fund since 2007 | ||
| Paul Bouchey, CFA | Managed Fund since 2019 | ||
| Jennifer Sireklove, CFA | Managed Fund since 2019 |
Portfolio profile subject to change due to active management. Percentages may not total 100% due to rounding.
RISK CONSIDERATIONS
The value of investments held by the Fund may increase or decrease in response to economic, and financial events (whether real, expected or perceived) in the U.S. and global markets. The value of equity securities is sensitive to stock market volatility. Investments in foreign instruments or currencies can involve greater risk and volatility than U.S. investments because of adverse market, economic, political, regulatory, geopolitical, currency exchange rates or other conditions. In emerging countries, these risks may be more significant. Smaller companies are generally subject to greater price fluctuations, limited liquidity, higher transaction costs and higher investment risk than larger, more established companies. Market conditions may limit the ability to generate tax losses or to generate dividend income taxed at favorable tax rates. The Fund's ability to utilize various tax-managed techniques may be curtailed or eliminated by tax legislation regulation or interpretation. The Fund is exposed to liquidity risk when trading volume, lack of a market maker or trading partner, large position size, market conditions, or legal restrictions impair its ability to sell particular investments or to sell them at advantageous market prices. The sub-adviser uses proprietary investment techniques and analyses in making investment decisions for the Fund. A systematic investment process is dependent on the sub-adviser’s skill in developing and maintaining that process. The impact of the coronavirus on global markets could last for an extended period and could adversely affect the Fund’s performance. No fund is a complete investment program and you may lose money investing in a fund. The Fund may engage in other investment practices that may involve additional risks and you should review the Fund prospectus for a complete description.
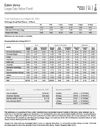
Performance
|
|
|||||||
| Annualized | |||||||
| 1 Mo. | 3 Mos. | YTD | 1 Yr. | 3 Yrs. | 5 Yrs. | 10 Yrs. | |
| Fund at NAV | 2.00 | 1.82 | 1.82 | 9.12 | 0.51 | 2.56 | 1.88 |
| Return After Taxes on Dist | — | — | — | 7.60 | -1.02 | 1.54 | 1.26 |
| Return After Taxes on Dist & Sales of Fund Shares | — | — | — | 6.31 | 0.69 | 2.27 | 1.69 |
| MSCI Emerging Markets Index1 | 2.48 | 2.37 | 2.37 | 8.15 | -5.05 | 2.22 | 2.94 |
| Morningstar Diversified Emerging Mkts Category5 | 2.01 | 2.70 | 2.70 | 10.31 | -3.83 | 3.23 | 2.96 |
| Past performance is no guarantee of future results. Investment return and principal value will fluctuate so that shares, when redeemed, may be worth more or less than their original cost. Performance is for the stated time period only; due to market volatility, the Fund’s current performance may be lower or higher than quoted. Returns are historical and are calculated by determining the percentage change in net asset value (NAV) with all distributions reinvested. Performance less than or equal to one year is cumulative. After-tax returns are calculated using certain assumptions, including using the highest individual federal income tax rates in effect at the time of the distributions and do not reflect the impact of state/local taxes. Actual after-tax returns depend on a shareholder's tax situation and the actual characterization of distributions and may differ from those shown. After-tax returns are not relevant to shareholders who hold shares in tax-deferred accounts or shares held by nontaxable entities. Return After Taxes on Distributions may be the same as Return Before Taxes for the same period because no taxable distributions were made during that period. Return After Taxes on Distributions and Sale of Fund Shares may be greater than or equal to Return After Taxes on Distributions for the same period because of losses realized on the sale of Fund shares. Before-tax and after-tax returns for other classes of shares offered by the Fund are different. The share class has no sales charge. |
|||||||
| 2014 | 2015 | 2016 | 2017 | 2018 | 2019 | 2020 | 2021 | 2022 | 2023 | |
| Fund at NAV | -3.61 | -15.75 | 12.10 | 27.09 | -13.20 | 12.51 | 4.46 | 4.61 | -12.24 | 10.65 |
| MSCI Emerging Markets Index1 | -2.19 | -14.92 | 11.19 | 37.28 | -14.57 | 18.42 | 18.31 | -2.54 | -20.09 | 9.83 |
| Class I Inception | 06/30/1998 |
| Expense Ratio2 | 0.96% |
| Adjusted Expense Ratio | 0.95% |
| Distribution Frequency | Annually |
| Adjusted Expense Ratios excludes certain investment expenses such as interest expense from borrowings and repurchase agreements and dividend expense from short sales, incurred directly by the Fund or indirectly through the Fund’s investment in underlying Parametric Funds, if applicable none of which are paid to Parametric. |
| Alpha (%) | 4.42 |
| Beta | 0.77 |
| R-Squared (%) | 91.94 |
| Standard Deviation (%) | 14.34 |
| Sharpe Ratio | -0.14 |
| Time Period | Rating | Funds in Diversified Emerging Mkts Category |
| Overall | 721 | |
| 3 Years | 721 | |
| 5 Years | 657 | |
| 10 Years | 425 | |
| The Morningstar Rating™ for funds, or "star rating", is calculated for managed products (including mutual funds and exchange-traded funds) with at least a three-year history. Exchange-traded funds and open-ended mutual funds are considered a single population for comparative purposes. It is calculated based on a Morningstar Risk-Adjusted Return measure that accounts for variation in a managed product's monthly excess performance, placing more emphasis on downward variations and rewarding consistent performance. The top 10% of products in each product category receive 5 stars, the next 22.5% receive 4 stars, the next 35% receive 3 stars, the next 22.5% receive 2 stars, and the bottom 10% receive 1 star. The Overall Morningstar Rating for a managed product is derived from a weighted average of the performance figures associated with its three-, five-, and 10-year (if applicable) Morningstar Rating metrics. The weights are: 100% three-year rating for 36-59 months of total returns, 60% five-year rating/40% three-year rating for 60-119 months of total returns, and 50% 10-year rating/30% five-year rating/20% three-year rating for 120 or more months of total returns. While the 10-year overall star rating formula seems to give the most weight to the 10-year period, the most recent three-year period actually has the greatest impact because it is included in all three rating periods. Star ratings do not reflect the effect of any applicable sales load. Hollow stars denote Morningstar Extended Performance Ratings and are considered estimates based on the performance of the fund's oldest share class, adjusted for fees and expenses. ©2024 Morningstar. All Rights Reserved. The information contained herein: (1) is proprietary to Morningstar and/or its content providers; (2) may not be copied or distributed; and (3) is not warranted to be accurate, complete or timely. Neither Morningstar nor its content providers are responsible for any damages or losses arising from any use of this information. |
| Date | NAV | NAV Change |
| Apr 26, 2024 | $40.26 | $0.36 |
| Apr 25, 2024 | $39.90 | $0.08 |
| Apr 24, 2024 | $39.82 | $0.04 |
| Apr 23, 2024 | $39.78 | $0.16 |
| Apr 22, 2024 | $39.62 | $0.25 |
| Apr 19, 2024 | $39.37 | -$0.16 |
| Apr 18, 2024 | $39.53 | $0.06 |
| Apr 17, 2024 | $39.47 | $0.00 |
| Apr 16, 2024 | $39.47 | -$0.49 |
| Apr 15, 2024 | $39.96 | -$0.34 |
| Ex-Date | Distribution | Reinvest NAV |
| Dec 28, 2023 | $1.46660 | $39.47 |
| Dec 29, 2022 | $1.56200 | $38.00 |
| Dec 29, 2021 | $1.24170 | $47.38 |
| No records in this table indicates that there has not been a distribution greater than .0001 within the past 3 years. Fund prospectus |
| Ex-Date | Short-Term | Long-Term | Reinvest NAV |
| Dec 28, 2023 | $0.84880 | $39.47 | |
| Dec 29, 2022 | $2.37130 | $38.00 | |
| Dec 29, 2021 | $0.05050 | $3.32880 | $47.38 |
| No records in this table indicates that there has not been a capital gain greater than .0001 within the past 3 years. Fund prospectus |
Portfolio profile subject to change due to active management. Percentages may not total 100% due to rounding.
RISK CONSIDERATIONS
The value of investments held by the Fund may increase or decrease in response to economic, and financial events (whether real, expected or perceived) in the U.S. and global markets. The value of equity securities is sensitive to stock market volatility. Investments in foreign instruments or currencies can involve greater risk and volatility than U.S. investments because of adverse market, economic, political, regulatory, geopolitical, currency exchange rates or other conditions. In emerging countries, these risks may be more significant. Smaller companies are generally subject to greater price fluctuations, limited liquidity, higher transaction costs and higher investment risk than larger, more established companies. Market conditions may limit the ability to generate tax losses or to generate dividend income taxed at favorable tax rates. The Fund's ability to utilize various tax-managed techniques may be curtailed or eliminated by tax legislation regulation or interpretation. The Fund is exposed to liquidity risk when trading volume, lack of a market maker or trading partner, large position size, market conditions, or legal restrictions impair its ability to sell particular investments or to sell them at advantageous market prices. The sub-adviser uses proprietary investment techniques and analyses in making investment decisions for the Fund. A systematic investment process is dependent on the sub-adviser’s skill in developing and maintaining that process. The impact of the coronavirus on global markets could last for an extended period and could adversely affect the Fund’s performance. No fund is a complete investment program and you may lose money investing in a fund. The Fund may engage in other investment practices that may involve additional risks and you should review the Fund prospectus for a complete description.
Portfolio
|
|
|
| Foreign Common Stocks | 99.32 |
| Cash & Other Assets | 0.68 |
| Total | 100.00 |
| Median Market Cap | 3.67 |
| Price/Earnings Ratio | 13.80 |
| Number of Holdings | 1411 |
| Price/Book Ratio | 1.50 |
| Countries Represented | 49 |
|
|
||
| Sector | Fund | MSCI Emerging Markets Index1 |
| Comm. Services | 9.04 | 8.62 |
| Consumer Discretionary | 9.73 | 12.43 |
| Consumer Staples | 9.63 | 5.63 |
| Energy | 9.62 | 5.32 |
| Financials | 12.50 | 22.35 |
| Health Care | 8.69 | 3.47 |
| Industrials | 10.31 | 6.49 |
| Information Technology | 8.97 | 23.84 |
| Materials | 10.02 | 7.55 |
| Real Estate | 5.25 | 1.53 |
| Utilities | 5.55 | 2.78 |
| Cash | 0.68 | 0.00 |
| China | 14.37 |
| Thailand | 4.61 |
| Korea | 4.93 |
| Mexico | 4.98 |
| Taiwan | 7.84 |
| South Africa | 4.77 |
| Brazil | 4.90 |
| India | 7.59 |
| Saudi Arabia | 4.90 |
| Turkey | 4.36 |
| View All |

|
|
|
| Asia/Pacific | 50.37 |
| Latin America | 15.94 |
| Eastern Europe | 11.38 |
| Africa | 8.22 |
| Middle East | 12.22 |
| Europe except U.K. | 1.84 |
| United States | 0.04 |
| Holding | % of Net Assets |
| Taiwan Semiconductor Manufacturing Co Ltd | 1.18% |
| Tencent Holdings Ltd | 1.05% |
| Samsung Electronics Co Ltd | 0.84% |
| Delta Electronics Thailand PCL | 0.73% |
| America Movil SAB de CV | 0.69% |
| Turkiye Petrol Rafinerileri AS | 0.64% |
| MercadoLibre Inc | 0.64% |
| Reliance Industries Ltd | 0.63% |
| Al Salam Bank-Bahrain BSC | 0.63% |
| Naspers Ltd | 0.56% |
| View All |
Portfolio profile subject to change due to active management. Percentages may not total 100% due to rounding.
RISK CONSIDERATIONS
The value of investments held by the Fund may increase or decrease in response to economic, and financial events (whether real, expected or perceived) in the U.S. and global markets. The value of equity securities is sensitive to stock market volatility. Investments in foreign instruments or currencies can involve greater risk and volatility than U.S. investments because of adverse market, economic, political, regulatory, geopolitical, currency exchange rates or other conditions. In emerging countries, these risks may be more significant. Smaller companies are generally subject to greater price fluctuations, limited liquidity, higher transaction costs and higher investment risk than larger, more established companies. Market conditions may limit the ability to generate tax losses or to generate dividend income taxed at favorable tax rates. The Fund's ability to utilize various tax-managed techniques may be curtailed or eliminated by tax legislation regulation or interpretation. The Fund is exposed to liquidity risk when trading volume, lack of a market maker or trading partner, large position size, market conditions, or legal restrictions impair its ability to sell particular investments or to sell them at advantageous market prices. The sub-adviser uses proprietary investment techniques and analyses in making investment decisions for the Fund. A systematic investment process is dependent on the sub-adviser’s skill in developing and maintaining that process. The impact of the coronavirus on global markets could last for an extended period and could adversely affect the Fund’s performance. No fund is a complete investment program and you may lose money investing in a fund. The Fund may engage in other investment practices that may involve additional risks and you should review the Fund prospectus for a complete description.
Management

Thomas C. Seto
Managing Director
Joined Parametric Portfolio Associates 1998
Biography
Tom is a managing director and head of investment management at Parametric Portfolio Associates LLC. He leads Parametric's portfolio management and trading functions for the firm's equity strategies. He is also a vice president and portfolio manager for Calvert Research and Management. He joined Parametric in 1998.
Tom began his career in the investment management industry in 1991. Before joining Parametric, he served as the head of U.S. equity index investments at Barclays Global Investors.
Tom earned a B.S. in electrical engineering from the University of Washington and an MBA from the University of Chicago Booth School of Business.
Education
- B.S. University of Washington
- M.B.A Booth School of Business, University of Chicago
Experience
- Managed Fund since 2007
Other funds managed

Paul Bouchey, CFA
Global Head of Research
Joined Parametric Portfolio Associates 2006
Biography
Paul Bouchey is chief investment officer of Parametric Portfolio Associates LLC, an investment adviser and majority-owned subsidiary of Eaton Vance Corp. Paul Bouchey leads Parametric's Investment, Research and Strategy activities. He is responsible for setting the overall research agenda and new product development. He joined Parametric in 2006.
Paul began his career in the investment management industry in 1994. Before joining Parametric, Paul was a senior researcher at Russell Investment Group, where he focused on simulation, optimization and quantitative decision models for institutional and private clients.
Paul earned a B.A. in mathematics and physics from Whitman College and an M.S. in computational finance and risk management from the University of Washington. He holds a patent on cross-sectional volatility indexing and has authored more than 10 academic and practitioner articles in journals such as The Journal of Portfolio Management, The Journal of Wealth Management and The Journal of Index Investing. He is a CFA charterholder.
Education
- B.A. Whitman College
- M.S. University of Washington
Experience
- Managed Fund since 2019
Other funds managed

Jennifer Sireklove, CFA
Managing Director, Investment Strategy
Joined Parametric Portfolio Associates 2013
Biography
Jennifer Sireklove is managing director, investment strategy for Parametric Portfolio Associates LLC, an investment adviser and majority-owned subsidiary of Eaton Vance Corp. She leads the investment strategy team, which is responsible for all aspects of Parametric's equity-based investment strategies. In addition, she has direct investment responsibility for Parametric's emerging-market and international strategies, and chairs Parametric's Stewardship Committee. She joined Parametric in 2013.
Jennifer began her career in the investment management industry in 2003. Previously at Parametric, she helped build the firm's active ownership and custom ESG portfolio construction practices. Before joining Parametric, she worked in equity research, primarily covering the energy, utility and industrial sectors at firms including D.A. Davidson and McAdams Wright Ragen.
Jennifer earned a B.A. in economics from Reed College and an MBA in finance and accounting from the University of Chicago. She is a CFA charterholder and a member of the CFA Society Seattle.
Education
- B.A. Reed College
- MBA University of Chicago
Experience
- Managed Fund since 2019
Other funds managed
Literature
Literature

Fact Sheet
Download Fact Sheet - Last updated: Mar 31, 2024
Commentary
Download Commentary - Last updated: Mar 31, 2024
Attribution
Download Attribution - Last updated: Mar 31, 2024

Annual Report
Download Annual Report - Last updated: Jun 30, 2023

Full Prospectus
Download Full Prospectus - Last updated: Nov 1, 2023

Q1 Holdings
Download Q1 Holdings - Last updated: Sep 30, 2023
Q3 Holdings
Download Q3 Holdings - Last updated: Mar 31, 2023
Holdings - Form N-PORT

SAI
Download SAI - Last updated: Nov 1, 2023

Semi-Annual Report
Download Semi-Annual Report - Last updated: Dec 31, 2023

Summary Prospectus
Download Summary Prospectus - Last updated: Nov 1, 2023
