
Overview
|
|
|||||||
| Annualized | |||||||
| 1 Mo. | 3 Mos. | YTD | 1 Yr. | 3 Yrs. | 5 Yrs. | 10 Yrs. | |
| Fund at NAV | 2.35 | 5.80 | 5.80 | 17.44 | 4.96 | 7.39 | 6.39 |
| Market Price | 3.10 | 7.84 | 7.84 | 10.79 | 1.24 | 5.65 | 5.76 |
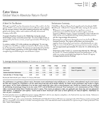
| Past performance is no guarantee of future results. Investment return and principal value will fluctuate so that shares, when sold, may be worth more or less than their original cost. Performance is for the stated time period only; due to market volatility, the Fund's current performance may be lower or higher than quoted. The Fund's performance at market price will differ from its results at NAV. Returns are historical and are calculated by determining the percentage change in net asset value or market price (as applicable) with all distributions reinvested and includes management fees and other expenses. Until the reinvestment of Fund distributions is completed, returns are calculated using the lower of the net asset value or market price of the shares on the distribution ex date. Once the reinvestment is complete, returns are calculated using the average reinvestment price. Performance less than or equal to one year is cumulative. The Fund has adopted a policy to pay common shareholders a stable monthly distribution, and may pay distributions consisting of amounts characterized for federal income tax purposes as qualified and non-qualified ordinary dividends, capital gains distributions and nondividend distributions, also known as return of capital. There is no assurance that the Fund will always be able to pay distributions of a particular size. Click here for more information. |
|||||||
| as of Apr 26, 2024 | |
| Distribution Rate at NAV | 8.75% |
| Distribution Rate at Market Price | 10.19% |
| Performance Inception | 09/30/2005 |
| Investment Objective | Current income and gains |
| Total Net Assets | $1.0B |
| CUSIP | 27829C105 |
| as of Annual Report dated 12/31/2023 | |
| Management Fees | 1.00 |
| Other Expenses | 0.11 |
| Total Expenses | 1.11 |
| Thomas C. Seto | Managed Fund since inception | ||
| Charles Gaffney | Managed Fund since 2023 | ||
| Douglas R. Rogers, CFA, CMT | Managed Fund since 2023 |
The information contained herein is provided for informational purposes only and does not constitute a solicitation of an offer to buy or sell Fund shares. Common shares of the Fund are only available for purchase and sale at current market price on a stock exchange. There is no assurance that the Fund will achieve its investment objective. The Fund is subject to numerous risks, including investment risks. Shares of closed-end funds often trade at a discount from their net asset value. The Fund is not a complete investment program and you may lose money investing in the Fund. An investment in the Fund may not be appropriate for all investors. Investors should review and consider carefully the Fund’s investment objective, risks, charges and expenses.
The premium/discount is calculated as [(market price/NAV)-1].
Links to Morningstar Fact Sheet and CEF Connect: By clicking on the link from this page to the Morningstar fact sheet or CEF Connect, you will leave the Eaton Vance website. Eaton Vance is not responsible for the content of any such third-party website. See “Terms and Conditions” below.
Eaton Vance Distributors, Inc., Member FINRA/SIPC, is an affiliate of Eaton Vance Management.
RISK CONSIDERATIONS
The value of investments held by the Fund may increase or decrease in response to economic, and financial events (whether real, expected or perceived) in the U.S. and global markets. The value of equity securities is sensitive to stock market volatility. A decision as to whether, when and how to use options involves the exercise of skill and judgment, and even a well-conceived and well-executed options program may be adversely affected by market behavior or unexpected events. The exercise of index call options sold by the Fund may require the Fund to sell portfolio securities to generate cash at inopportune times or for unattractive prices. In addition, the trading price of options may be adversely affected if the market for such options becomes less liquid or smaller. Investments in foreign instruments or currencies can involve greater risk and volatility than U.S. investments because of adverse market, economic, political, regulatory, geopolitical or other conditions. Market conditions may limit the ability to generate tax losses or to generate dividend income taxed at favorable tax rates. The Fund's ability to utilize various tax-managed techniques may be curtailed or eliminated in the future by tax legislation or regulation. The Fund’s exposure to derivatives involves risks different from, or possibly greater than, the risks associated with investing directly in securities and other investments. Derivatives instruments can be highly volatile, result in leverage (which can increase both the risk and return potential of the Fund) , and involve risks in addition to the risks of the underlying instrument on which the derivative is based, such as counterparty, correlation and liquidity risk. If a counterparty is unable to honor its commitments, the value of Fund shares may decline and/or the Fund could experience delays in the return of collateral or other assets held by the counterparty. The Fund's portfolio managers use quantitative investment techniques and analyses in making investment decisions for the Fund. There can be no assurance that these techniques will achieve the desired results. The impact of the coronavirus on global markets could last for an extended period and could adversely affect the Fund’s performance. The Fund may engage in other investment practices that may involve additional risks.
Performance
|
|
|||||||
| Annualized | |||||||
| 1 Mo. | 3 Mos. | YTD | 1 Yr. | 3 Yrs. | 5 Yrs. | 10 Yrs. | |
| Fund at NAV | 2.35 | 5.80 | 5.80 | 17.44 | 4.96 | 7.39 | 6.39 |
| Market Price | 3.10 | 7.84 | 7.84 | 10.79 | 1.24 | 5.65 | 5.76 |
| Past performance is no guarantee of future results. Investment return and principal value will fluctuate so that shares, when sold, may be worth more or less than their original cost. Performance is for the stated time period only; due to market volatility, the Fund's current performance may be lower or higher than quoted. The Fund's performance at market price will differ from its results at NAV. Returns are historical and are calculated by determining the percentage change in net asset value or market price (as applicable) with all distributions reinvested and includes management fees and other expenses. Until the reinvestment of Fund distributions is completed, returns are calculated using the lower of the net asset value or market price of the shares on the distribution ex date. Once the reinvestment is complete, returns are calculated using the average reinvestment price. Performance less than or equal to one year is cumulative. The Fund has adopted a policy to pay common shareholders a stable monthly distribution, and may pay distributions consisting of amounts characterized for federal income tax purposes as qualified and non-qualified ordinary dividends, capital gains distributions and nondividend distributions, also known as return of capital. There is no assurance that the Fund will always be able to pay distributions of a particular size. Click here for more information. |
|||||||
| 2014 | 2015 | 2016 | 2017 | 2018 | 2019 | 2020 | 2021 | 2022 | 2023 | |
| Fund at NAV | 2.97 | 3.92 | 3.46 | 19.28 | -7.72 | 18.05 | 8.55 | 15.19 | -15.73 | 17.88 |
| Market Price | 0.19 | 12.59 | 0.14 | 30.47 | -11.76 | 18.88 | 3.00 | 25.48 | -23.77 | 9.29 |
| Performance Inception | 09/30/2005 |
| as of Apr 26, 2024 | |
| Distribution Rate at NAV | 8.75% |
| Distribution Rate at Market Price | 10.19% |
| Ex-Date | Distribution | Reinvest Price |
| Apr 22, 2024 | $0.06640 | |
| Mar 20, 2024 | $0.05820 | |
| Feb 21, 2024 | $0.05820 | |
| Jan 22, 2024 | $0.05820 | |
| Dec 21, 2023 | $0.05820 | |
| Nov 21, 2023 | $0.05820 | |
| Oct 20, 2023 | $0.05820 | |
| Sep 21, 2023 | $0.05820 | |
| Aug 21, 2023 | $0.05820 | |
| Jul 21, 2023 | $0.05820 | |
| View All | ||
| No records in this table indicates that there has not been a distribution greater than .0001 within the past 3 years. |

| Ordinary Dividends | ||||||||
| Non-Qualified | Qualified | Total | Capital Gain Distributions | Nondividend Distributions | Total Distributions | |||
| Distributions ($) | ||||||||
|---|---|---|---|---|---|---|---|---|
| 2023 | $0.00 | $0.13 | $0.13 | $0.30 | $0.27 | $0.70 | ||
| 2022 | $0.02 | $0.22 | $0.24 | $0.52 | $0.08 | $0.84 | ||
| 2021 | $0.00 | $0.16 | $0.16 | $0.53 | $0.18 | $0.87 | ||
| 2020 | $0.00 | $0.08 | $0.08 | $0.44 | $0.36 | $0.87 | ||
| 2019 | $0.00 | $0.14 | $0.14 | $0.09 | $0.64 | $0.87 | ||
| 2018 | $0.00 | $0.13 | $0.13 | $0.55 | $0.41 | $1.09 | ||
| 2017 | $0.00 | $0.15 | $0.15 | $0.00 | $0.95 | $1.10 | ||
| 2016 | $0.00 | $0.16 | $0.16 | $0.00 | $1.01 | $1.17 | ||
| 2015 | $0.00 | $0.18 | $0.18 | $0.00 | $0.99 | $1.17 | ||
| 2014 | $0.00 | $0.24 | $0.24 | $0.00 | $0.93 | $1.17 | ||
| 2013 | $0.00 | $0.19 | $0.19 | $0.00 | $0.98 | $1.17 | ||
| 2012 | $0.00 | $0.23 | $0.23 | $0.00 | $0.94 | $1.17 | ||
| 2011 | $0.00 | $0.19 | $0.19 | $0.00 | $1.02 | $1.21 | ||
| 2010 | $0.00 | $0.17 | $0.17 | $0.02 | $1.28 | $1.47 | ||
| 2009 | $0.00 | $0.20 | $0.20 | $0.00 | $1.60 | $1.80 | ||
| 2008 | $0.00 | $0.38 | $0.38 | $0.00 | $1.42 | $1.80 | ||
| 2007 | $0.00 | $0.09 | $0.09 | $0.05 | $1.66 | $1.80 | ||
| 2006 | $0.00 | $0.31 | $0.31 | $0.05 | $1.44 | $1.80 | ||
| 2005 | $0.03 | $0.06 | $0.09 | $0.08 | $0.28 | $0.45 | ||
| Distributions (%) | ||||||||
| 2023 | 0.00% | 17.91% | 17.91% | 43.63% | 38.46% | 100.00% | ||
| 2022 | 2.76% | 25.75% | 28.51% | 62.06% | 9.43% | 100.00% | ||
| 2021 | 0.00% | 18.78% | 18.78% | 60.46% | 20.76% | 100.00% | ||
| 2020 | 0.00% | 9.20% | 9.20% | 49.96% | 40.84% | 100.00% | ||
| 2019 | 0.00% | 16.23% | 16.23% | 10.22% | 73.55% | 100.00% | ||
| 2018 | 0.00% | 11.76% | 11.76% | 50.38% | 37.86% | 100.00% | ||
| 2017 | 0.00% | 13.50% | 13.50% | 0.00% | 86.50% | 100.00% | ||
| 2016 | 0.00% | 13.30% | 13.30% | 0.00% | 86.70% | 100.00% | ||
| 2015 | 0.00% | 15.65% | 15.65% | 0.00% | 84.35% | 100.00% | ||
| 2014 | 0.00% | 20.68% | 20.68% | 0.00% | 79.32% | 100.00% | ||
| 2013 | 0.00% | 16.17% | 16.17% | 0.00% | 83.83% | 100.00% | ||
| 2012 | 0.00% | 19.98% | 19.98% | 0.00% | 80.02% | 100.00% | ||
| 2011 | 0.00% | 16.02% | 16.02% | 0.00% | 83.98% | 100.00% | ||
| 2010 | 0.00% | 11.34% | 11.34% | 1.31% | 87.35% | 100.00% | ||
| 2009 | 0.00% | 11.10% | 11.10% | 0.00% | 88.90% | 100.00% | ||
| 2008 | 0.00% | 20.89% | 20.89% | 0.00% | 79.11% | 100.00% | ||
| 2007 | 0.00% | 4.75% | 4.75% | 2.84% | 92.41% | 100.00% | ||
| 2006 | 0.00% | 17.11% | 17.11% | 2.99% | 79.90% | 100.00% | ||
| 2005 | 6.49% | 14.01% | 20.50% | 18.43% | 61.07% | 100.00% | ||
The information contained herein is provided for informational purposes only and does not constitute a solicitation of an offer to buy or sell Fund shares. Common shares of the Fund are only available for purchase and sale at current market price on a stock exchange. There is no assurance that the Fund will achieve its investment objective. The Fund is subject to numerous risks, including investment risks. Shares of closed-end funds often trade at a discount from their net asset value. The Fund is not a complete investment program and you may lose money investing in the Fund. An investment in the Fund may not be appropriate for all investors. Investors should review and consider carefully the Fund’s investment objective, risks, charges and expenses.
The premium/discount is calculated as [(market price/NAV)-1].
Links to Morningstar Fact Sheet and CEF Connect: By clicking on the link from this page to the Morningstar fact sheet or CEF Connect, you will leave the Eaton Vance website. Eaton Vance is not responsible for the content of any such third-party website. See “Terms and Conditions” below.
Eaton Vance Distributors, Inc., Member FINRA/SIPC, is an affiliate of Eaton Vance Management.
RISK CONSIDERATIONS
The value of investments held by the Fund may increase or decrease in response to economic, and financial events (whether real, expected or perceived) in the U.S. and global markets. The value of equity securities is sensitive to stock market volatility. A decision as to whether, when and how to use options involves the exercise of skill and judgment, and even a well-conceived and well-executed options program may be adversely affected by market behavior or unexpected events. The exercise of index call options sold by the Fund may require the Fund to sell portfolio securities to generate cash at inopportune times or for unattractive prices. In addition, the trading price of options may be adversely affected if the market for such options becomes less liquid or smaller. Investments in foreign instruments or currencies can involve greater risk and volatility than U.S. investments because of adverse market, economic, political, regulatory, geopolitical or other conditions. Market conditions may limit the ability to generate tax losses or to generate dividend income taxed at favorable tax rates. The Fund's ability to utilize various tax-managed techniques may be curtailed or eliminated in the future by tax legislation or regulation. The Fund’s exposure to derivatives involves risks different from, or possibly greater than, the risks associated with investing directly in securities and other investments. Derivatives instruments can be highly volatile, result in leverage (which can increase both the risk and return potential of the Fund) , and involve risks in addition to the risks of the underlying instrument on which the derivative is based, such as counterparty, correlation and liquidity risk. If a counterparty is unable to honor its commitments, the value of Fund shares may decline and/or the Fund could experience delays in the return of collateral or other assets held by the counterparty. The Fund's portfolio managers use quantitative investment techniques and analyses in making investment decisions for the Fund. There can be no assurance that these techniques will achieve the desired results. The impact of the coronavirus on global markets could last for an extended period and could adversely affect the Fund’s performance. The Fund may engage in other investment practices that may involve additional risks.
Portfolio
| Holding | % of Net Assets |
| Microsoft Corp | 5.28% |
| Apple Inc | 4.47% |
| NVIDIA Corp | 3.28% |
| Amazon.com Inc | 3.11% |
| ASML Holding NV | 2.36% |
| Meta Platforms Inc | 2.26% |
| LVMH Moet Hennessy Louis Vuitton SE | 2.24% |
| Nestle SA | 1.85% |
| Allianz SE | 1.52% |
| Siemens AG | 1.51% |
| View All |
The information contained herein is provided for informational purposes only and does not constitute a solicitation of an offer to buy or sell Fund shares. Common shares of the Fund are only available for purchase and sale at current market price on a stock exchange. There is no assurance that the Fund will achieve its investment objective. The Fund is subject to numerous risks, including investment risks. Shares of closed-end funds often trade at a discount from their net asset value. The Fund is not a complete investment program and you may lose money investing in the Fund. An investment in the Fund may not be appropriate for all investors. Investors should review and consider carefully the Fund’s investment objective, risks, charges and expenses.
The premium/discount is calculated as [(market price/NAV)-1].
Links to Morningstar Fact Sheet and CEF Connect: By clicking on the link from this page to the Morningstar fact sheet or CEF Connect, you will leave the Eaton Vance website. Eaton Vance is not responsible for the content of any such third-party website. See “Terms and Conditions” below.
RISK CONSIDERATIONS
The value of investments held by the Fund may increase or decrease in response to economic, and financial events (whether real, expected or perceived) in the U.S. and global markets. The value of equity securities is sensitive to stock market volatility. A decision as to whether, when and how to use options involves the exercise of skill and judgment, and even a well-conceived and well-executed options program may be adversely affected by market behavior or unexpected events. The exercise of index call options sold by the Fund may require the Fund to sell portfolio securities to generate cash at inopportune times or for unattractive prices. In addition, the trading price of options may be adversely affected if the market for such options becomes less liquid or smaller. Investments in foreign instruments or currencies can involve greater risk and volatility than U.S. investments because of adverse market, economic, political, regulatory, geopolitical or other conditions. Market conditions may limit the ability to generate tax losses or to generate dividend income taxed at favorable tax rates. The Fund's ability to utilize various tax-managed techniques may be curtailed or eliminated in the future by tax legislation or regulation. The Fund’s exposure to derivatives involves risks different from, or possibly greater than, the risks associated with investing directly in securities and other investments. Derivatives instruments can be highly volatile, result in leverage (which can increase both the risk and return potential of the Fund) , and involve risks in addition to the risks of the underlying instrument on which the derivative is based, such as counterparty, correlation and liquidity risk. If a counterparty is unable to honor its commitments, the value of Fund shares may decline and/or the Fund could experience delays in the return of collateral or other assets held by the counterparty. The Fund's portfolio managers use quantitative investment techniques and analyses in making investment decisions for the Fund. There can be no assurance that these techniques will achieve the desired results. The impact of the coronavirus on global markets could last for an extended period and could adversely affect the Fund’s performance. The Fund may engage in other investment practices that may involve additional risks.
Eaton Vance Distributors, Inc., Member FINRA/SIPC, is an affiliate of Eaton Vance Management.
Management

Thomas C. Seto
Managing Director
Joined Parametric Portfolio Associates 1998
Biography
Tom is a managing director and head of investment management at Parametric Portfolio Associates LLC. He leads Parametric's portfolio management and trading functions for the firm's equity strategies. He is also a vice president and portfolio manager for Calvert Research and Management. He joined Parametric in 1998.
Tom began his career in the investment management industry in 1991. Before joining Parametric, he served as the head of U.S. equity index investments at Barclays Global Investors.
Tom earned a B.S. in electrical engineering from the University of Washington and an MBA from the University of Chicago Booth School of Business.
Education
- B.S. University of Washington
- M.B.A Booth School of Business, University of Chicago
Experience
- Managed Fund since inception
Other funds managed

Charles Gaffney
Managing Director, Portfolio Manager
Biography
Charlie is a managing director of Morgan Stanley and a portfolio manager on the Eaton Vance Core/Growth team. He is responsible for buy and sell decisions, portfolio construction and risk management for a number of Eaton Vance U.S. core equity strategies. He is a member of the Eaton Vance Equity Strategy Committee. He is also a vice president and portfolio manager for Calvert Research and Management. He joined Eaton Vance in 2003. Morgan Stanley acquired Eaton Vance in March 2021.
Charlie began his career in the investment management industry in 1996. Before joining Eaton Vance, he was a sector portfolio manager with Brown Brothers Harriman and a senior equity analyst with Morgan Stanley Dean Witter.
Charlie earned a B.A. from Bowdoin College and an MBA from Fordham University.
Education
- B.A. Bowdoin College
- M.B.A. Graduate School of Business, Fordham University
Experience
- Managed Fund since 2023
Other funds managed

Douglas R. Rogers, CFA, CMT
Executive Director, Portfolio Manager
Joined Eaton Vance 2001
Biography
Doug is an executive director of Morgan Stanley and a portfolio manager on the Eaton Vance Core/Growth team. He is responsible for buy and sell decisions, portfolio construction and risk management for Eaton Vance growth equity strategies. In addition, he covers the information technology and communication services sectors. He joined Eaton Vance in 2001. Morgan Stanley acquired Eaton Vance in March 2021.
Doug served as a nuclear submarine officer in the United States Navy prior to beginning his career in the investment management industry in 1999. Before joining Eaton Vance, he was a research analyst with Endeca Technologies Inc.
Doug earned a B.S. from the United States Naval Academy and an MBA from Harvard Business School. He holds the Chartered Market Technician (CMT®) designation and is a CFA charterholder.
Education
- B.S. United States Naval Academy
- M.B.A. Harvard University
Experience
- Managed Fund since 2023
Other funds managed
Literature
Literature

Fact Sheet
Download Fact Sheet - Last updated: Dec 31, 2023
Commentary
Download Commentary - Last updated: Mar 31, 2024

Report of Organizational Actions Affecting Basis of Securities
Download Report of Organizational Actions Affecting Basis of Securities - Last updated: Jan 21, 2021
Report of Organizational Actions Affecting Basis of Securities
Download Report of Organizational Actions Affecting Basis of Securities - Last updated: Jan 15, 2020

Annual Report
Download Annual Report - Last updated: Dec 31, 2023
Equity Option Closed-End Fund Guide
Download Equity Option Closed-End Fund Guide - Last updated: Dec 31, 2023

Full Prospectus
Download Full Prospectus - Last updated: May 10, 2022
Q1 Holdings
Download Q1 Holdings - Last updated: Mar 31, 2023
Q3 Holdings
Download Q3 Holdings - Last updated: Sep 30, 2023
Holdings - Form N-PORT

Return of Capital Distributions Demystified
Download Return of Capital Distributions Demystified - Last updated: Mar 7, 2024
Eaton Vance Announces Updated Results of Closed-End Fund Share Repurchase Programs
Download Eaton Vance Announces Updated Results of Closed-End Fund Share Repurchase Programs - Last updated: Jan 9, 2014
Distribution Dates and Amounts Announced for Eaton Vance Closed-End Funds
Download Distribution Dates and Amounts Announced for Eaton Vance Closed-End Funds - Last updated: Apr 1, 2024
Eaton Vance Closed-End Funds Release Estimated Sources Of Distributions
Download Eaton Vance Closed-End Funds Release Estimated Sources Of Distributions - Last updated: Mar 28, 2024
Distribution Dates and Amounts Announced for Eaton Vance Closed-End Funds
Download Distribution Dates and Amounts Announced for Eaton Vance Closed-End Funds - Last updated: Mar 1, 2024
Eaton Vance Closed-End Funds Release Estimated Sources Of Distributions
Download Eaton Vance Closed-End Funds Release Estimated Sources Of Distributions - Last updated: Feb 29, 2024
Distribution Dates and Amounts Announced for Eaton Vance Closed-End Funds
Download Distribution Dates and Amounts Announced for Eaton Vance Closed-End Funds - Last updated: Feb 1, 2024
Eaton Vance Closed-End Funds Release Estimated Sources Of Distributions
Download Eaton Vance Closed-End Funds Release Estimated Sources Of Distributions - Last updated: Jan 31, 2024
Distribution Dates and Amounts Announced for Eaton Vance Closed-End Funds
Download Distribution Dates and Amounts Announced for Eaton Vance Closed-End Funds - Last updated: Jan 2, 2024
Eaton Vance Closed-End Funds Release Estimated Sources Of Distributions
Download Eaton Vance Closed-End Funds Release Estimated Sources Of Distributions - Last updated: Dec 29, 2023
Distribution Dates and Amounts Announced for Eaton Vance Closed-End Funds
Download Distribution Dates and Amounts Announced for Eaton Vance Closed-End Funds - Last updated: Dec 1, 2023
Eaton Vance Closed-End Funds Release Estimated Sources Of Distributions
Download Eaton Vance Closed-End Funds Release Estimated Sources Of Distributions - Last updated: Nov 30, 2023
Distribution Dates and Amounts Announced for Eaton Vance Closed-End Funds
Download Distribution Dates and Amounts Announced for Eaton Vance Closed-End Funds - Last updated: Nov 1, 2023
Eaton Vance Closed-End Funds Release Estimated Sources Of Distributions
Download Eaton Vance Closed-End Funds Release Estimated Sources Of Distributions - Last updated: Oct 31, 2023
Distribution Dates and Amounts Announced for Eaton Vance Closed-End Funds
Download Distribution Dates and Amounts Announced for Eaton Vance Closed-End Funds - Last updated: Oct 2, 2023
Eaton Vance Closed-End Funds Release Estimated Sources Of Distributions
Download Eaton Vance Closed-End Funds Release Estimated Sources Of Distributions - Last updated: Sep 29, 2023
Distribution Dates and Amounts Announced for Eaton Vance Closed-End Funds
Download Distribution Dates and Amounts Announced for Eaton Vance Closed-End Funds - Last updated: Sep 1, 2023
Eaton Vance Closed-End Funds Release Estimated Sources Of Distributions
Download Eaton Vance Closed-End Funds Release Estimated Sources Of Distributions - Last updated: Aug 31, 2023
Distribution Dates and Amounts Announced for Eaton Vance Closed-End Funds
Download Distribution Dates and Amounts Announced for Eaton Vance Closed-End Funds - Last updated: Aug 1, 2023
Eaton Vance Closed-End Funds Release Estimated Sources Of Distributions
Download Eaton Vance Closed-End Funds Release Estimated Sources Of Distributions - Last updated: Jul 31, 2023
Distribution Dates and Amounts Announced for Eaton Vance Closed-End Funds
Download Distribution Dates and Amounts Announced for Eaton Vance Closed-End Funds - Last updated: Jul 3, 2023
Eaton Vance Closed-End Funds Release Estimated Sources Of Distributions
Download Eaton Vance Closed-End Funds Release Estimated Sources Of Distributions - Last updated: Jun 30, 2023
Distribution Dates and Amounts Announced for Eaton Vance Closed-End Funds
Download Distribution Dates and Amounts Announced for Eaton Vance Closed-End Funds - Last updated: Jun 1, 2023
Eaton Vance Closed-End Funds Release Estimated Sources Of Distributions
Download Eaton Vance Closed-End Funds Release Estimated Sources Of Distributions - Last updated: May 31, 2023
Distribution Dates and Amounts Announced for Eaton Vance Closed-End Funds
Download Distribution Dates and Amounts Announced for Eaton Vance Closed-End Funds - Last updated: May 1, 2023
Eaton Vance Closed-End Funds Release Estimated Sources Of Distributions
Download Eaton Vance Closed-End Funds Release Estimated Sources Of Distributions - Last updated: Apr 28, 2023
Distribution Dates and Amounts Announced for Eaton Vance Closed-End Funds
Download Distribution Dates and Amounts Announced for Eaton Vance Closed-End Funds - Last updated: Apr 3, 2023
Eaton Vance Closed-End Funds Release Estimated Sources Of Distributions
Download Eaton Vance Closed-End Funds Release Estimated Sources Of Distributions - Last updated: Mar 31, 2023
Distribution Dates and Amounts Announced for Eaton Vance Closed-End Funds
Download Distribution Dates and Amounts Announced for Eaton Vance Closed-End Funds - Last updated: Mar 1, 2023
Eaton Vance Closed-End Funds Release Estimated Sources Of Distributions
Download Eaton Vance Closed-End Funds Release Estimated Sources Of Distributions - Last updated: Feb 28, 2023
Eaton Vance Closed-End Funds Release Estimated Sources of Distribution
Download Eaton Vance Closed-End Funds Release Estimated Sources of Distribution - Last updated: Jan 31, 2023
Distribution Dates and Amounts Announced for Eaton Vance Closed-End Funds
Download Distribution Dates and Amounts Announced for Eaton Vance Closed-End Funds - Last updated: Jan 3, 2023
Eaton Vance Closed-End Funds Release Estimated Sources of Distribution
Download Eaton Vance Closed-End Funds Release Estimated Sources of Distribution - Last updated: Dec 30, 2022
Distribution Dates and Amounts Announced for Eaton Vance Closed-End Funds
Download Distribution Dates and Amounts Announced for Eaton Vance Closed-End Funds - Last updated: Dec 1, 2022
Eaton Vance Closed-End Funds Release Estimated Sources of Distribution
Download Eaton Vance Closed-End Funds Release Estimated Sources of Distribution - Last updated: Nov 30, 2022
Distribution Dates and Amounts Announced for Eaton Vance Closed-End Funds
Download Distribution Dates and Amounts Announced for Eaton Vance Closed-End Funds - Last updated: Nov 1, 2022
Eaton Vance Closed-End Funds Release Estimated Sources of Distribution
Download Eaton Vance Closed-End Funds Release Estimated Sources of Distribution - Last updated: Oct 31, 2022
Distribution Dates and Amounts Announced for Eaton Vance Closed-End Funds
Download Distribution Dates and Amounts Announced for Eaton Vance Closed-End Funds - Last updated: Oct 3, 2022
Eaton Vance Closed-End Funds Release Estimated Sources of Distribution
Download Eaton Vance Closed-End Funds Release Estimated Sources of Distribution - Last updated: Sep 30, 2022
Distribution Dates and Amounts Announced for Eaton Vance Closed-End Funds
Download Distribution Dates and Amounts Announced for Eaton Vance Closed-End Funds - Last updated: Sep 1, 2022
Eaton Vance Closed-End Funds Release Estimated Sources of Distribution
Download Eaton Vance Closed-End Funds Release Estimated Sources of Distribution - Last updated: Aug 31, 2022
Distribution Dates and Amounts Announced for Eaton Vance Closed-End Funds
Download Distribution Dates and Amounts Announced for Eaton Vance Closed-End Funds - Last updated: Aug 1, 2022
Eaton Vance Closed-End Funds Release Estimated Sources of Distribution
Download Eaton Vance Closed-End Funds Release Estimated Sources of Distribution - Last updated: Jul 29, 2022
Distribution Dates and Amounts Announced for Eaton Vance Closed-End Funds
Download Distribution Dates and Amounts Announced for Eaton Vance Closed-End Funds - Last updated: Jul 1, 2022
Eaton Vance Closed-End Funds Release Estimated Sources of Distribution
Download Eaton Vance Closed-End Funds Release Estimated Sources of Distribution - Last updated: Jun 30, 2022
Distribution Dates and Amounts Announced for Eaton Vance Closed-End Funds
Download Distribution Dates and Amounts Announced for Eaton Vance Closed-End Funds - Last updated: Jun 1, 2022
Eaton Vance Closed-End Funds Release Estimated Sources of Distribution
Download Eaton Vance Closed-End Funds Release Estimated Sources of Distribution - Last updated: May 31, 2022
Distribution Dates and Amounts Announced for Eaton Vance Closed-End Funds
Download Distribution Dates and Amounts Announced for Eaton Vance Closed-End Funds - Last updated: May 2, 2022
Eaton Vance Closed-End Funds Release Estimated Sources Of Distributions
Download Eaton Vance Closed-End Funds Release Estimated Sources Of Distributions - Last updated: Apr 29, 2022
Certain Eaton Vance Closed-End Funds Announce Telephonic Annual Meeting Of Shareholders On April 15, 2021
Download Certain Eaton Vance Closed-End Funds Announce Telephonic Annual Meeting Of Shareholders On April 15, 2021 - Last updated: Apr 5, 2021
Results of Joint Special Shareholder Meeting of Certain Eaton Vance Closed-End Funds
Download Results of Joint Special Shareholder Meeting of Certain Eaton Vance Closed-End Funds - Last updated: Jan 25, 2021
Corrected Results of Joint Special Shareholder Meeting of Certain Eaton Vance Closed-End Funds
Download Corrected Results of Joint Special Shareholder Meeting of Certain Eaton Vance Closed-End Funds - Last updated: Jan 12, 2021
Results of Joint Special Shareholder Meeting of Certain Eaton Vance Closed-End Funds
Download Results of Joint Special Shareholder Meeting of Certain Eaton Vance Closed-End Funds - Last updated: Jan 8, 2021
Certain Eaton Vance Closed-End Funds Joint Special Meeting of Shareholders on January 7, 2021 Will Be a Virtual Meeting
Download Certain Eaton Vance Closed-End Funds Joint Special Meeting of Shareholders on January 7, 2021 Will Be a Virtual Meeting - Last updated: Dec 23, 2020
Eaton Vance Closed-End Funds Announce Board Approval of New Investment Advisory and Sub-Advisory Agreements
Download Eaton Vance Closed-End Funds Announce Board Approval of New Investment Advisory and Sub-Advisory Agreements - Last updated: Nov 10, 2020
Eaton Vance Closed-End Funds Announce Record and Meeting Dates For Joint Special Meeting of Shareholders
Download Eaton Vance Closed-End Funds Announce Record and Meeting Dates For Joint Special Meeting of Shareholders - Last updated: Oct 29, 2020
Certain Eaton Vance Closed-End Funds Announce Telephonic Annual Meeting of Shareholders on April 16, 2020
Download Certain Eaton Vance Closed-End Funds Announce Telephonic Annual Meeting of Shareholders on April 16, 2020 - Last updated: Apr 6, 2020
Distribution Dates and Amounts Announced for Eaton Vance Closed-End Funds and Portfolio Managers of Eaton Have High Income 2021 Target Term Trust (NYSE: EHT)
Download Distribution Dates and Amounts Announced for Eaton Vance Closed-End Funds and Portfolio Managers of Eaton Have High Income 2021 Target Term Trust (NYSE: EHT) - Last updated: Jan 2, 2020
Distribution Dates and Distribution Rate Changes Announced for Certain Eaton Vance Closed-End Funds
Download Distribution Dates and Distribution Rate Changes Announced for Certain Eaton Vance Closed-End Funds - Last updated: Jan 2, 2019
Eaton Vance Closed-End Funds Release Estimated Sources of Distribution
Download Eaton Vance Closed-End Funds Release Estimated Sources of Distribution - Last updated: May 31, 2017
Distribution Dates and Amounts Announced for Eaton Vance Closed-End Funds
Download Distribution Dates and Amounts Announced for Eaton Vance Closed-End Funds - Last updated: May 1, 2017
Eaton Vance Closed-End Funds Release Estimated Sources of Distributions
Download Eaton Vance Closed-End Funds Release Estimated Sources of Distributions - Last updated: Apr 28, 2017
Distribution Dates and Amounts Announced for Eaton Vance Closed-End Funds
Download Distribution Dates and Amounts Announced for Eaton Vance Closed-End Funds - Last updated: Apr 3, 2017
Distribution Dates and Distribution Rate Changes Announced for Certain Eaton Vance Closed-End Funds
Download Distribution Dates and Distribution Rate Changes Announced for Certain Eaton Vance Closed-End Funds - Last updated: Mar 1, 2017
Eaton Vance Updates Results of Equity Option CEF Share Repurchase Program
Download Eaton Vance Updates Results of Equity Option CEF Share Repurchase Program - Last updated: Oct 4, 2013
Eaton Vance Announces Updated Results of Equity Option Closed-End Fund Share Repurchase Program
Download Eaton Vance Announces Updated Results of Equity Option Closed-End Fund Share Repurchase Program - Last updated: Sep 19, 2013
Eaton Vance Announces Results of Equity Option Closed-End Fund Share Repurchase Program
Download Eaton Vance Announces Results of Equity Option Closed-End Fund Share Repurchase Program - Last updated: May 1, 2013
Eaton Vance Announces Results of Equity Option Closed-End Fund Share Repurchase Program
Download Eaton Vance Announces Results of Equity Option Closed-End Fund Share Repurchase Program - Last updated: Mar 8, 2013
Eaton Vance Equity Option CEFs Adopt Share Repurchase Program
Download Eaton Vance Equity Option CEFs Adopt Share Repurchase Program - Last updated: Aug 8, 2012

SAI
Download SAI - Last updated: Apr 29, 2022
Section 16 Filings - www.sec.gov
Download Section 16 Filings - www.sec.gov - Last updated: Jun 30, 2011

Semi-Annual Report
Download Semi-Annual Report - Last updated: Jun 30, 2023
